tagged actually this is a map
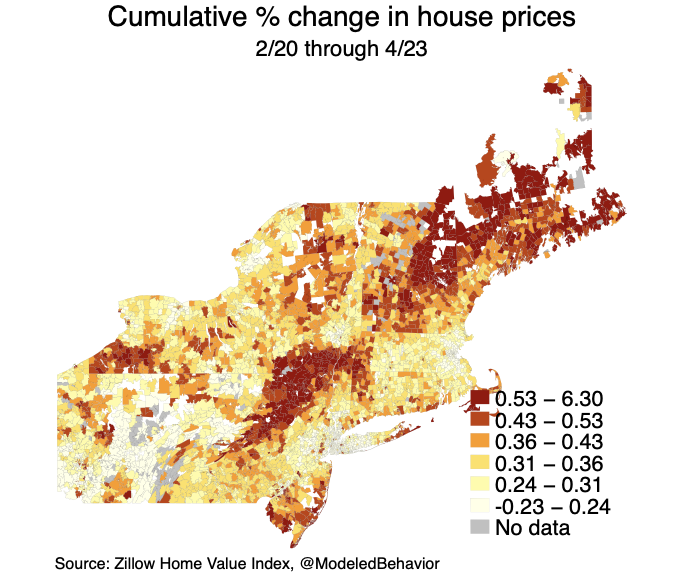
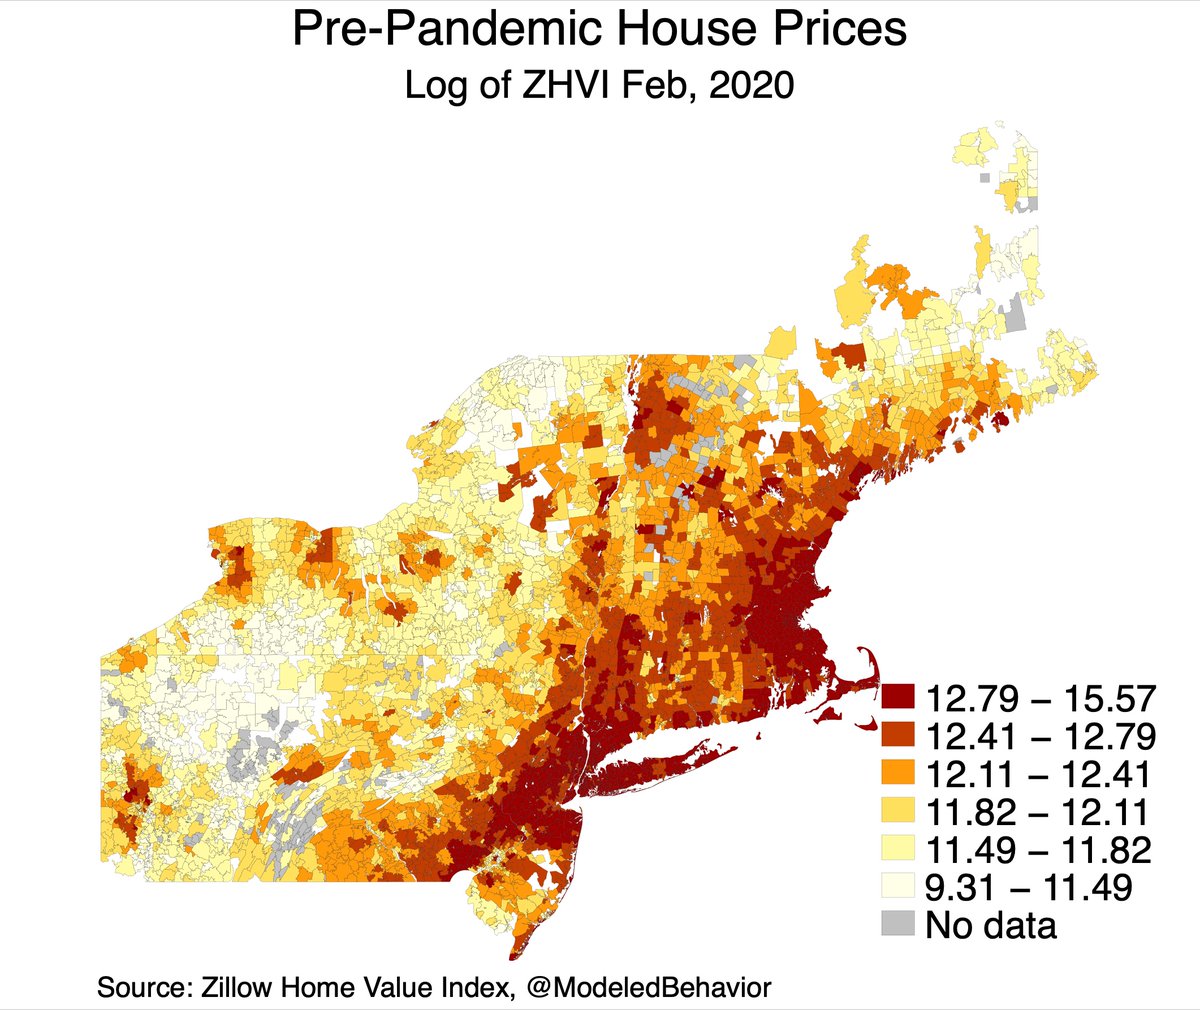
The geographic pattern of house price change in the Northeast since the pandemic began is just stunning. Demand is being pushed out of expensive places
contributed by Andy on May 26, 2023 in covid, progress?, actually this is a map
 video
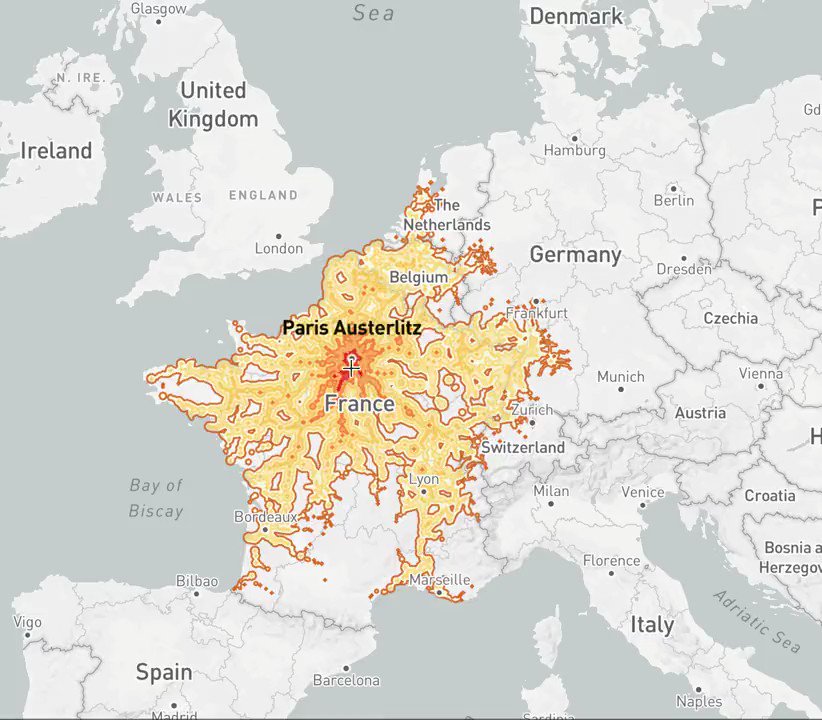
videoThis map shows how far you can travel from each station in Europe in less than 5 hours! 👉🏼 https://t.co/QLO21YSVsR
contributed by Andy on Nov 4, 2022 in actually this is a map
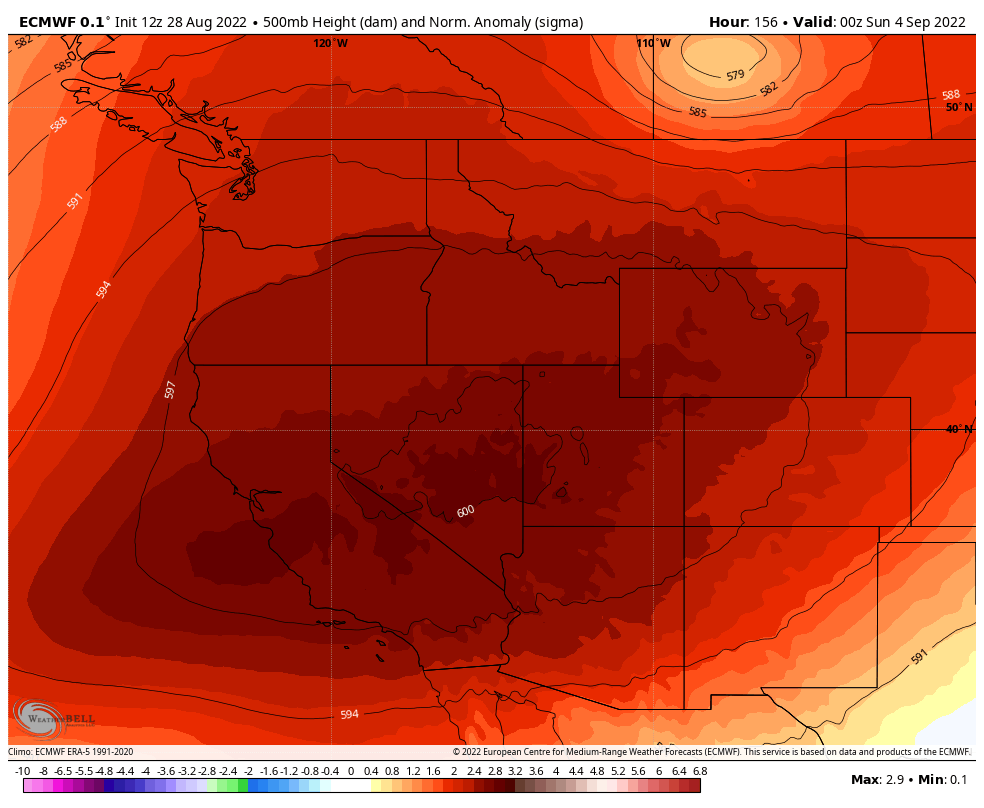
Models are continuing to double down on a severe, prolonged heatwave for California and surrounding states in early September. European model now suggesting the development of a 600 dm ridge which, if occurred, could bring all-time record high September heat. Stay tuned. #CAwx
contributed by Andy on Aug 28, 2022 in weather, actually this is a map
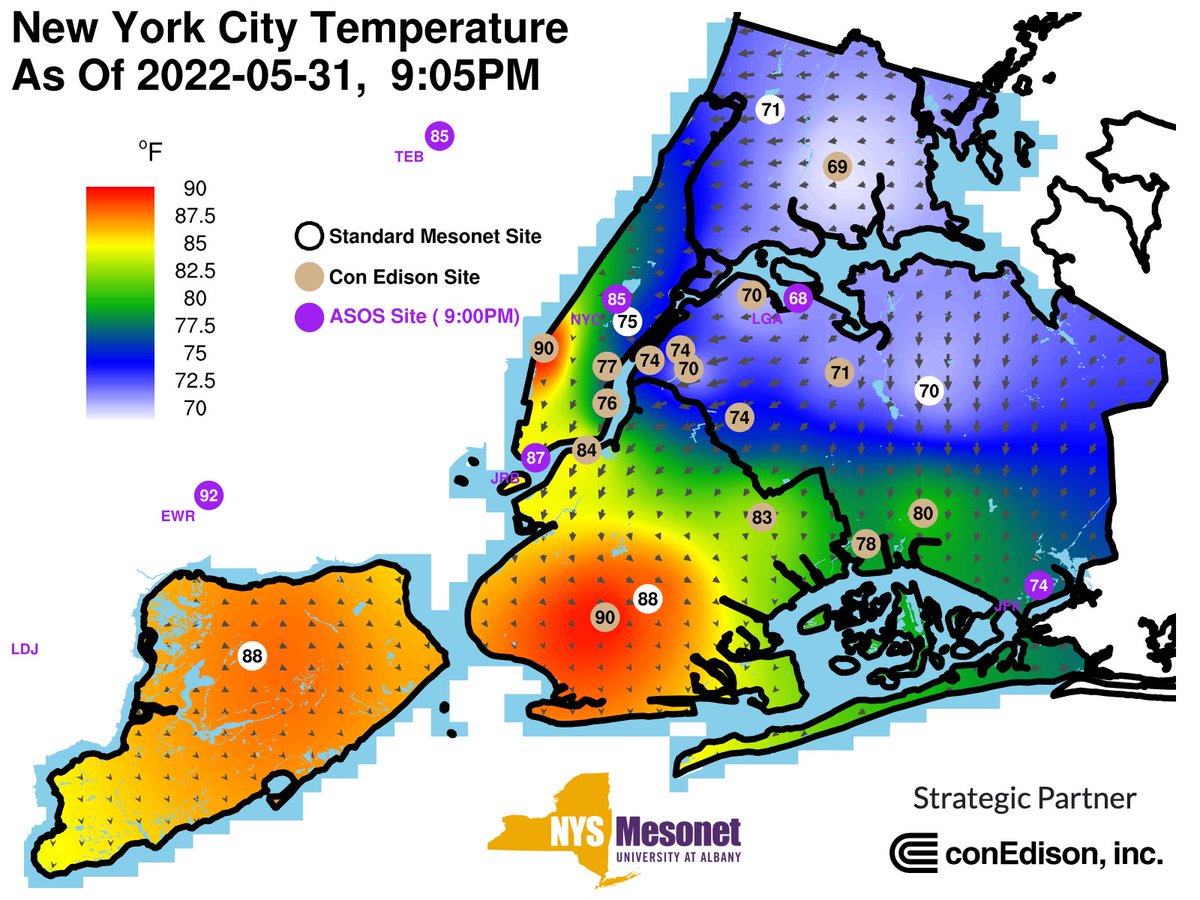
This is about the weirdest temperature distribution in #NYC you'll see. A rapidly moving backdoor front (east -> west) has dropped temperatures in Queens/Bronx down to below 70F (aided by Long Island Sound). Meanwhile, it's still 90F in parts of Brooklyn/Manhattan! #nywx #nycwx
contributed by Andy on May 31, 2022 in weather, actually this is a map
end of the notebook.