tagged ggplot in the wild
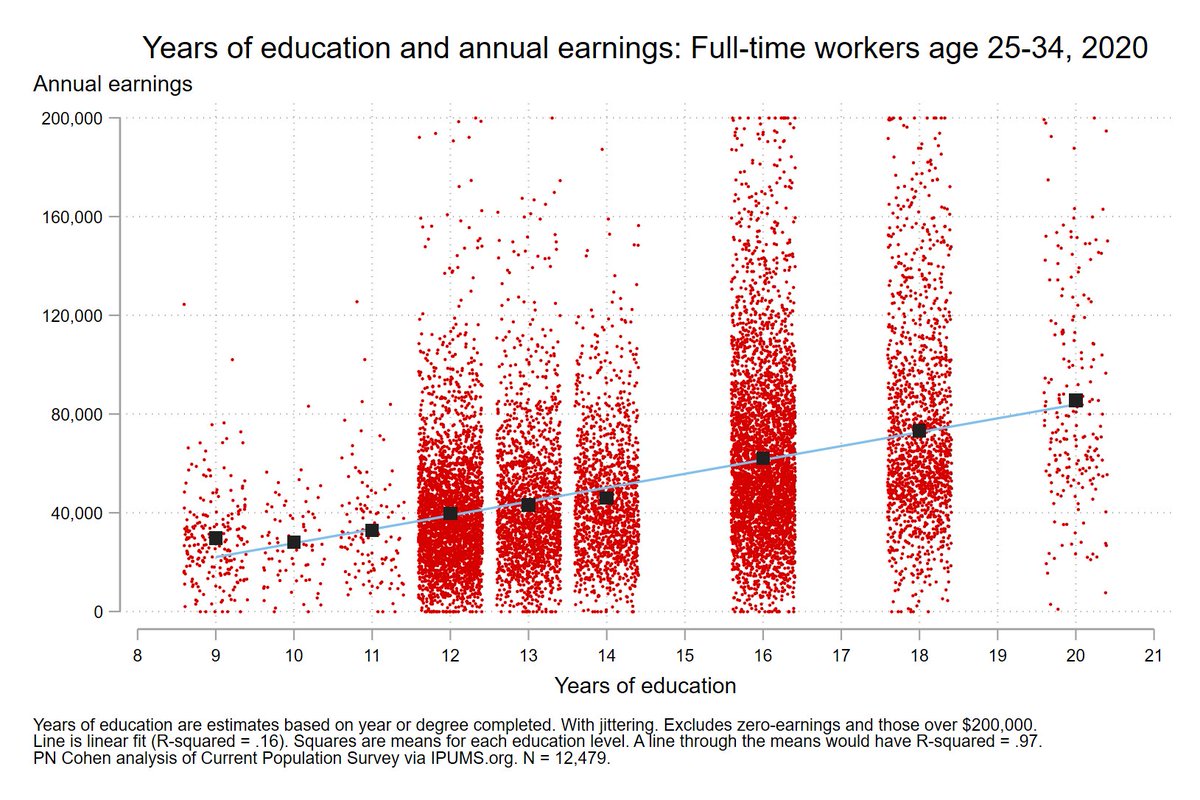
Now you know: What an extremely strong causal relationship looks like in social science: Education and earnings for full-time workers ages 25-34 (R2=.16, unless you draw the line through the means, then it's .97)
contributed by Andy on Oct 25, 2021 in scatters, causality, ggplot in the wild
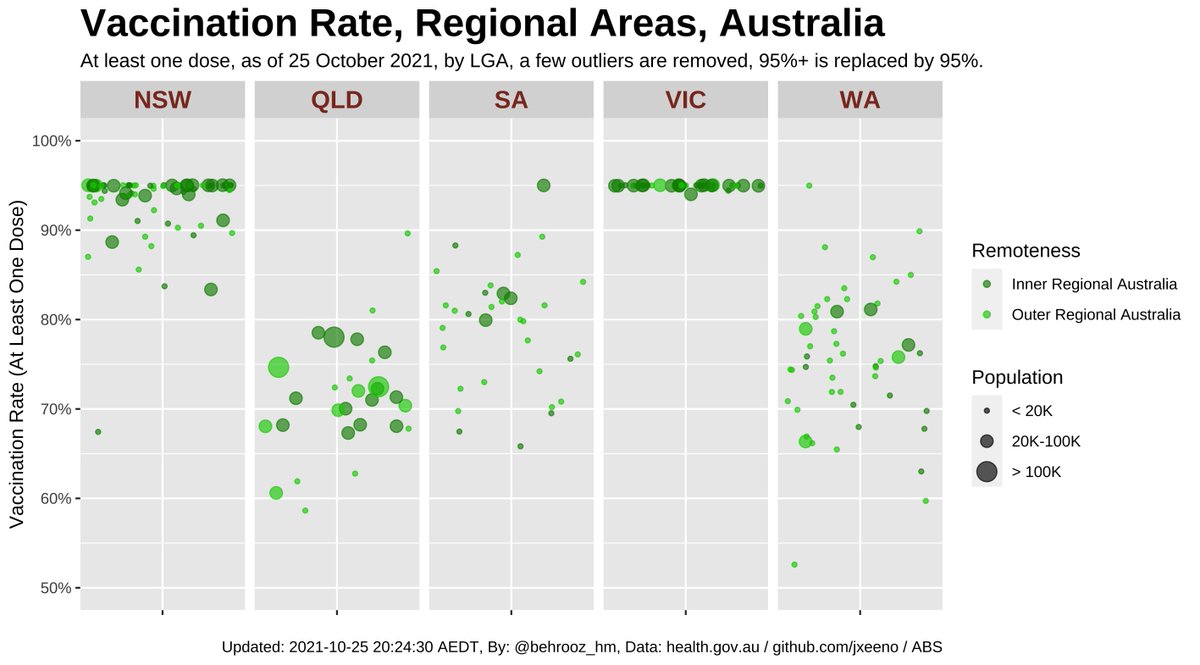
Regional Victoria converges into a line at 95%. #Covid19VicData #CovidVic #COVID19nsw #COVID19Aus
contributed by Andy on Oct 23, 2021 in ggplot in the wild, covid
end of the notebook.